German Aerospace Center (DLR), Köln · 2021
Satellite Telemetry Anomaly Detection
Catches failure precursors in satellite telemetry — and refuses to trust its own alarm when the evidence is contaminated.
The industrial problem
A satellite in operation streams thousands of telemetry channels — temperatures, voltages, currents, attitude data — around the clock. Somewhere in that flood, the earliest signs of a component failure appear as deviations too subtle for an operator watching dashboards to catch, and out-of-limit alarms only fire once the damage is already done.
The hard part is not detection, it is trust. Anomalies are rare, unlabelled and expensive to miss, while false alarms destroy an operations team’s willingness to act on the system at all. And there is a trap underneath: if the model’s own input window is already contaminated, the detection it produces is built on corrupted evidence. Anomalies should not be used to detect anomalies.
The system
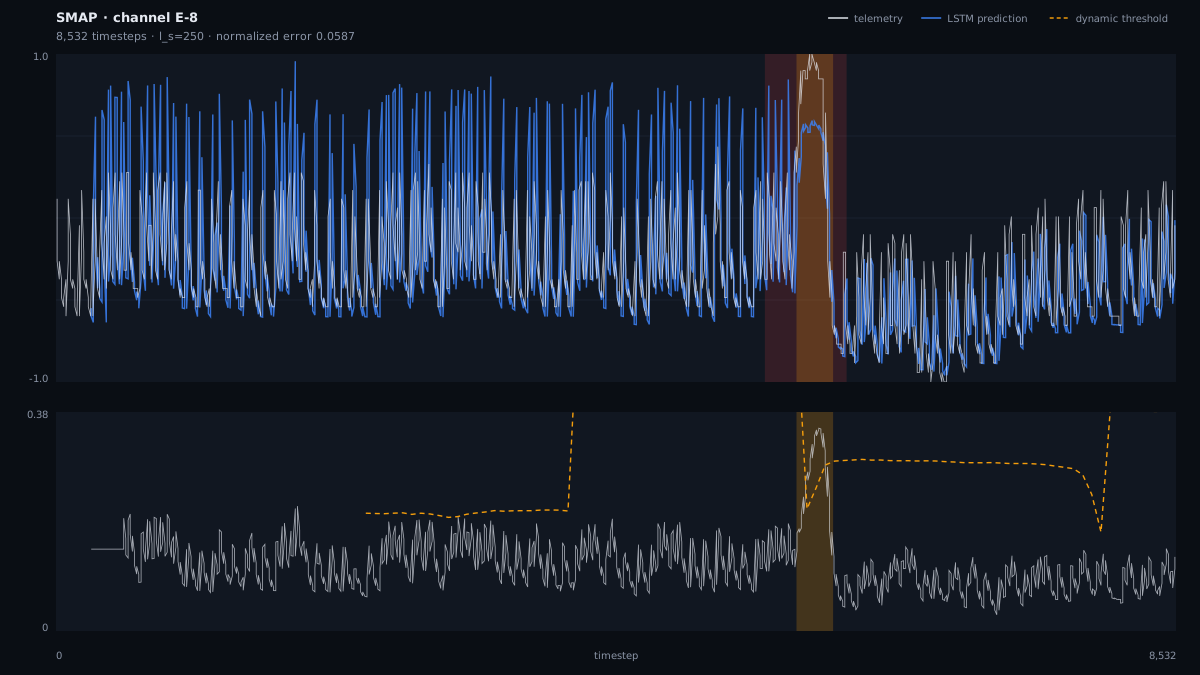
Rendered directly from the stored run output (channel E-8, 8,532 timesteps). The red band is the ground-truth anomaly window shipped with the benchmark; the amber band is what the model flagged, with no other detection raised on this channel.
[1] Prediction tracks the channel closely while the spacecraft behaves normally.
[2] The channel departs from its learned pattern; prediction and reality separate.
[3] Smoothed error crosses the dynamic threshold — the detection, not a fixed limit, fires here.
Scroll the figure sideways →
Explaining the alarm, then grading it
Real output from the project’s own evaluation scripts on the public NASA benchmark — first what the detector looked at, then whether that evidence was worth believing.
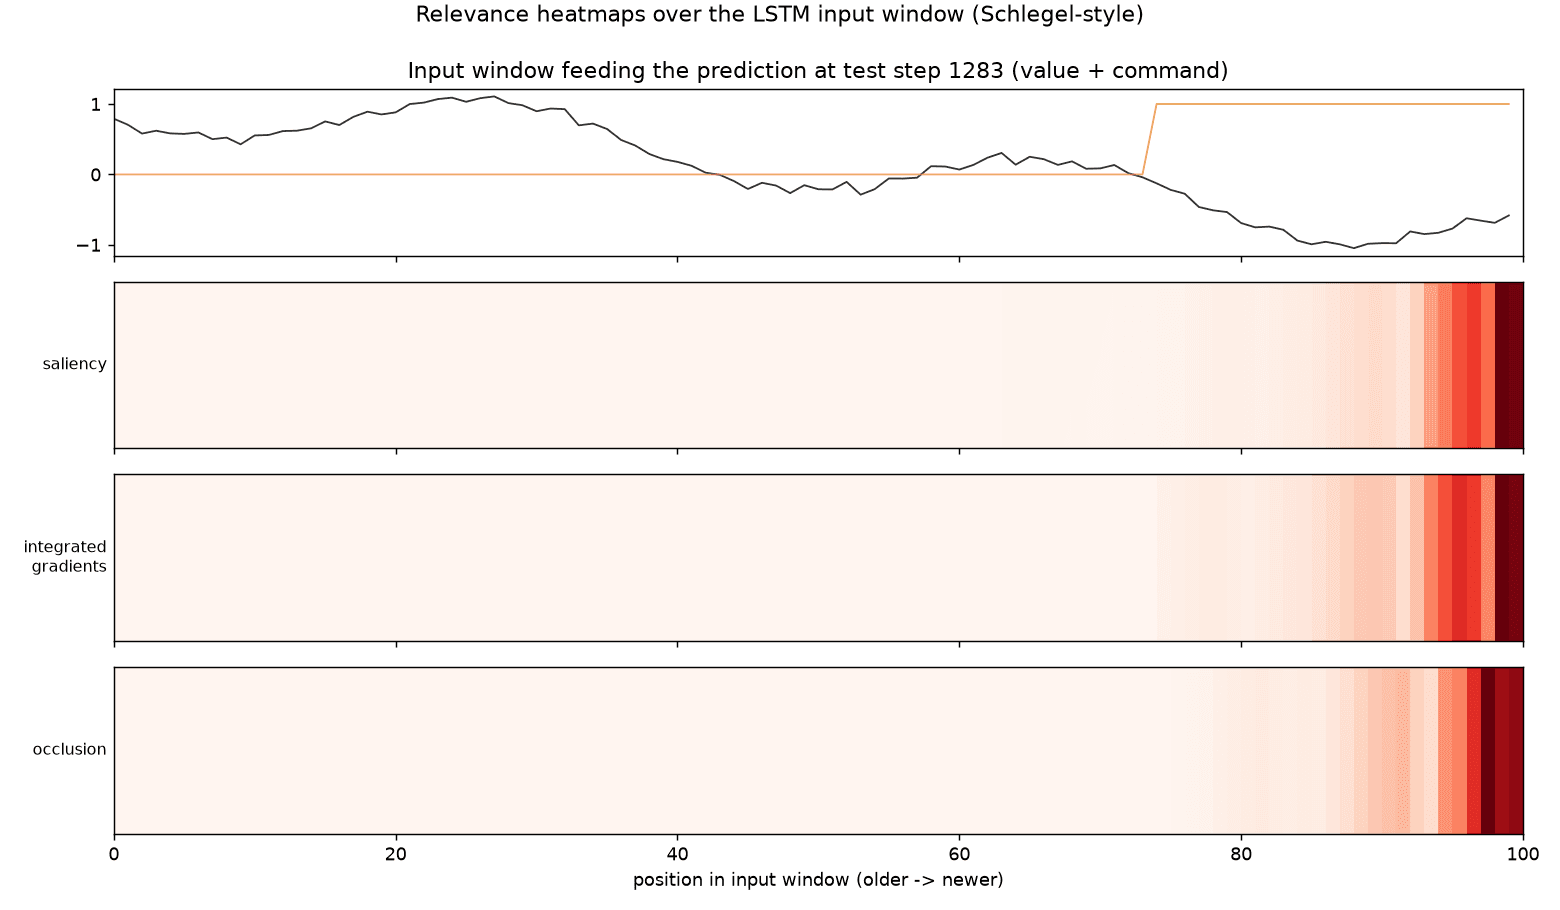
Which part of the input actually drove the prediction. Three independent attribution methods are run over the same window and they agree: the decision rests on the newest timesteps, not on the older history. Agreement between methods is the check — a single attribution map proves nothing on its own.
Scroll the figure sideways →
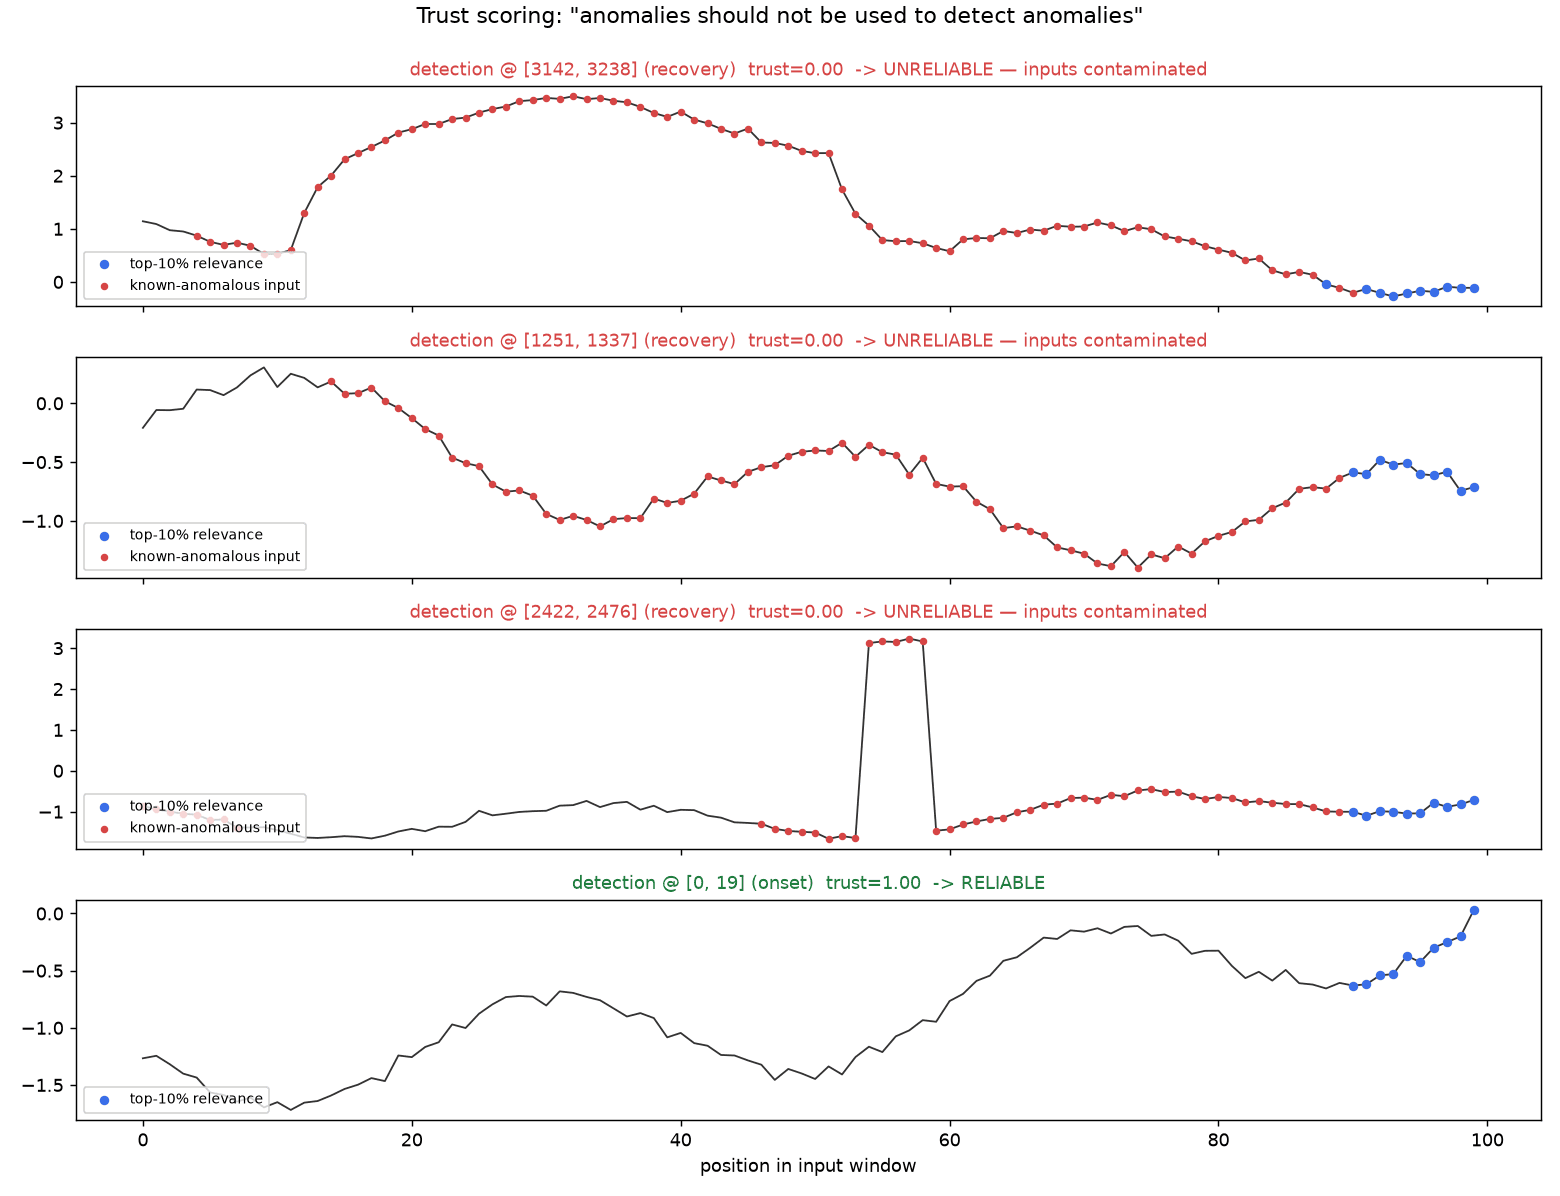
The contribution, stated plainly. In the top three panels the evidence the detector leaned on was itself already flagged anomalous, so the system reports the detection as UNRELIABLE rather than raising it as fact. Only the bottom panel — where the relevant inputs are clean — is escalated as a trustworthy alarm.
Scroll the figure sideways →
How it was built
- 01
Predict, then measure surprise
An LSTM learns one-step-ahead prediction per telemetry channel, with the spacecraft command stream as a model input. The prediction error is smoothed and compared against a nonparametric dynamic threshold that adapts as the mission’s definition of "normal" drifts — no fixed limits, no hand-tuned bands.
- 02
Explain every detection
Each alarm is passed through XAI relevance attribution (saliency, integrated gradients, occlusion) over the input window, so an operator sees which timesteps and which channels actually drove the flag — not just that something fired.
- 03
Score the trustworthiness of the alarm
The contribution of the thesis: measure how much of the attributed relevance sits on inputs that were themselves flagged anomalous. Below a trust threshold the system does not stay silent and does not cry wolf — it escalates the detection as UNRELIABLE, which is the honest answer.
What it measured
- 1.00
- Precision — no false positives raised
- 0.64
- Recall — 7 of 11 labelled anomalies caught
- 6
- SMAP & MSL telemetry channels evaluated
Measured on the public NASA SMAP/MSL spacecraft telemetry benchmark by an open reimplementation of the method — not on DLR mission data, which is not public. Recall is reported as measured, misses included.
What this builds on
- Hundman et al., KDD 2018
- Detecting Spacecraft Anomalies Using LSTMs and Nonparametric Dynamic Thresholding — the prediction and thresholding backbone.
- Schlegel et al., ICCVW 2019
- Towards a Rigorous Evaluation of XAI Methods on Time Series — the relevance-verification protocol used to check the explanations.
Archive: DLR/robust-telemetry-anomaly